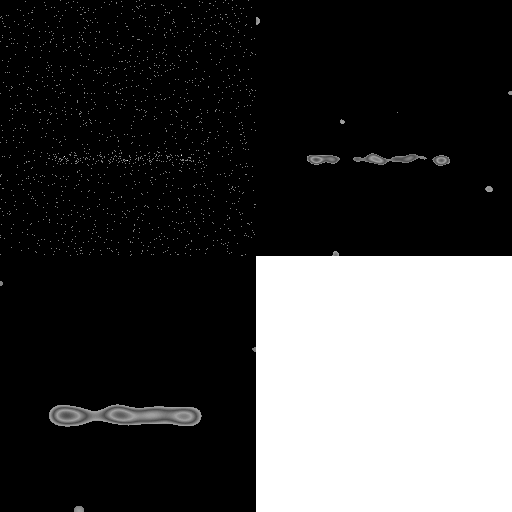
Where is the minefield?

Detecting a minefield in coastal and inshore waters may rely on supposed
detections, and many spurious or clutter detections. A representative
image of such point detections is shown, with the greater density shown as
a horizontal band near the bottom of the image. The other two images in this
animation are the 4th and 5th wavelet transform scales. They can be used to
demarcate the minefield.
Commands used
The point pattern set was generated in S-Plus using 1500 points for the
Poisson clutter, and 200 points for the "stochastic bar" which were also
distributed as a Poisson distribution but with an additive Gaussian component.
Thus the problem is one of finding 200 "interesting" points among 1500
uninteresting points. The points' coordinates were read into IDL, an image
produced, and this was written to a FITS file.
The significance limits for detection were set up with
mr_abaque -d. This was followed by the determining of the support
image at each of 6 resolution scales, mr_psupport -I c.fits -s xxx -p
cout. The support images were extracted using mr_extract -x cout.mr
cout. Finally the support images were converted to GIF, following
color-coding (13 rainbow) in IDL.
Another important command is mr_detect which not only detects the
clusters, with support for lots of noise models, but also calculates and
outputs parameters for all objects or `blobs' found. The objects or blobs
can be at different resolution scales, or a combination of them.
To probe further
Working
Group on Model-Based Clustering for Marked Spatial Point
Processes, sponsored by Office of Naval Research.
Image and Data Analysis: The Multiscale Approach, J-L Starck,
F Murtagh and A Bijaoui, Cambridge University Press, 1998.
